Momentum trading thrives on price action, and nothing showcases price action better than chart patterns. These patterns are visual representations of market psychology, capturing the collective behavior of traders and investors. For momentum traders, understanding and using the right chart patterns can mean the difference between entering early in a trend or catching the tail-end of a reversal.
In this guide, we’ll dive into the best chart patterns that support momentum trades, show how to use them effectively, and explain the psychology behind them.
Why Chart Patterns Matter in Momentum Trading
Momentum trading is all about riding the wave — catching a stock when it starts to move and exiting before it fizzles out. The challenge is identifying these waves early. That’s where chart patterns come into play.
They help you:
- Identify trend continuation or reversal
- Spot accumulation and distribution zones
- Time your entry and exit
- Set stop-loss and profit targets based on logical levels
Before diving into the actual patterns, if you’re new to momentum trading, read our foundational blog:
👉 Momentum Trading: What It Is and How It Works
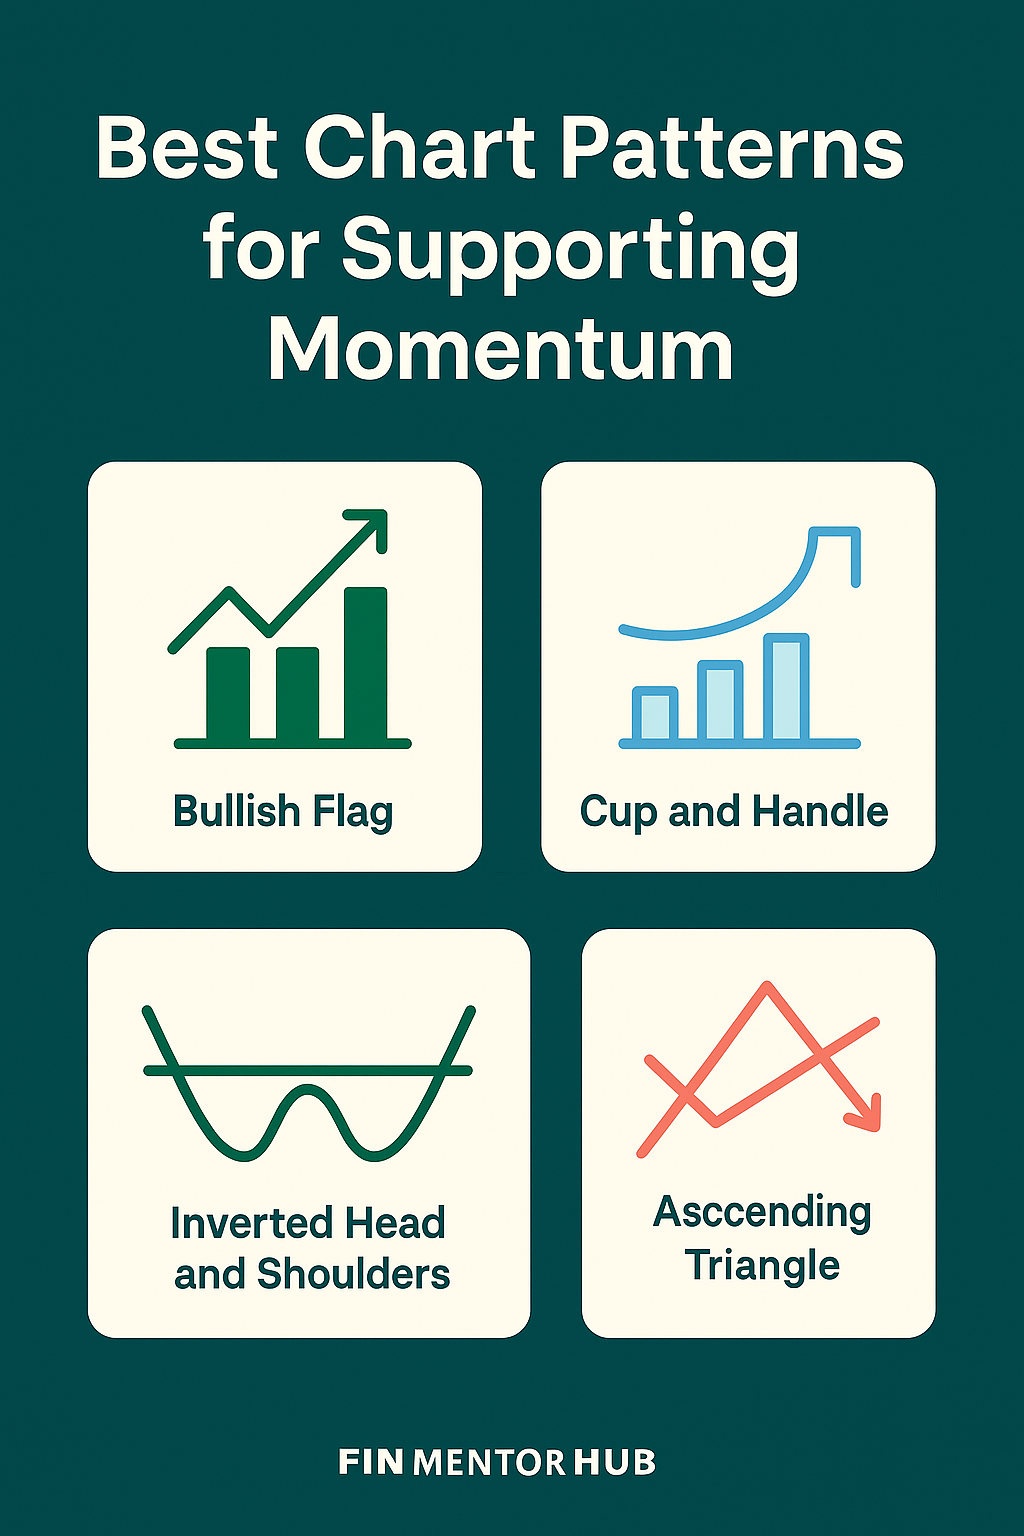
1. Bullish Flag and Pennant Patterns
Description:
These patterns appear after a strong price rally, showing a brief period of consolidation before the trend continues.
- Bullish Flag: Forms a rectangular shape sloping against the trend
- Bullish Pennant: Forms a small symmetrical triangle
Why It Works:
It represents a pause in buying — not selling — meaning the bulls are taking a breather. Once the pattern breaks upward, it often signals another strong move.
Entry Strategy:
- Enter on breakout with volume
- Stop-loss just below the pattern
Example:
Seen often in fast-moving stocks post-news or earnings.
External Resource:
Investopedia on Flag Patterns
2. Cup and Handle
Description:
Looks like a teacup — a rounded bottom followed by a small pullback (the handle).
Why It Works:
This pattern reflects accumulation after a downtrend or sideways market. The handle shakeout removes weak hands before the breakout.
Entry Strategy:
- Entry when the price breaks the handle
- Stop-loss slightly below the handle low
Used by: Swing traders, positional momentum traders
3. Ascending Triangle
Description:
Price makes higher lows but hits resistance at the same level, forming a triangle.
Why It Works:
Buyers are getting more aggressive, pushing price higher, while sellers keep defending a level. Once supply dries up, price bursts through.
Entry Strategy:
- Entry on breakout
- Stop-loss just below last higher low
Internal Tip:
This pattern is common in breakout and retest strategies. For full breakdown, check our blog:
👉 Breakout and Retest Strategy for Momentum Traders
4. Symmetrical Triangle
Description:
Price compresses between converging trendlines.
Why It Works:
It shows indecision. When the breakout occurs with volume, it often kickstarts a new directional momentum.
Entry Strategy:
- Entry on breakout in direction of trend
- Place tight stop-loss within pattern
Pro Tip: Confirm with RSI or ADX for momentum strength.
5. Double Bottom (W Pattern)
Description:
Price drops, rebounds, drops again to a similar level, then starts rising.
Why It Works:
It indicates that sellers tried and failed to push the stock lower, creating a psychological support zone.
Entry Strategy:
- Buy after breakout above the middle peak of the ‘W’
- Stop-loss below the second bottom
Best Used: Post-downtrend reversals or at key support levels.
6. Breakout from Consolidation
Description:
Stock moves in a tight range for days/weeks, then breaks out with volume.
Why It Works:
The longer the consolidation, the stronger the breakout. It’s a sign that smart money has been quietly accumulating.
Entry Strategy:
- Enter on breakout candle close
- Confirm with volume + moving averages
Tool to Scan These:
Use Chartink scanners to find these setups in real-time. Here’s a scanner to help:
Chartink Narrow Range Breakout
7. Inverted Head and Shoulders
Description:
Three lows with the middle one (head) being the lowest.
Why It Works:
It signals exhaustion of sellers and increasing buying interest.
Entry Strategy:
- Buy on neckline breakout
- Stop-loss below the right shoulder
Momentum Insight:
Often appears after downtrends, signaling trend reversal into a fresh uptrend.
8. Rectangle Patterns
Description:
Price moves sideways between support and resistance in a box-shaped range.
Why It Works:
It shows accumulation or distribution. Breakouts often lead to sharp moves.
Entry Strategy:
- Enter on breakout in direction of the prevailing trend
- Target = height of rectangle projected from breakout
Bonus Tip: Use volume spikes to validate breakouts.
9. Rising Channel (Cautionary Pattern)
Description:
Price moves up within parallel trendlines
Why It’s Tricky:
Though bullish, momentum can wane. A break below the lower trendline often leads to sharp corrections.
Strategy:
- Use with trailing stop-losses
- Exit on breakdown from the channel
Internal Link Summary
To get better at applying these patterns:
- Revisit Momentum Trading: What It Is and How It Works
- Read Top Indicators for Momentum Trading for technical confirmation
- Try Breakout and Retest Strategy for high-RRR trades
External Resources
Final Thoughts
Chart patterns are not magic — they reflect mass psychology. Recognizing them early and pairing them with confirmation indicators like volume, RSI, or ADX gives you an edge as a momentum trader.
Don’t memorize — internalize. Practice spotting these patterns on historical charts. The more you see them, the better your execution will be in real-time.
Want more practical trading tips?
Subscribe to our newsletter or follow us on Instagram, YouTube, and Twitter for weekly updates.